Additional Data
What kind of data?
Process Chart additionally accepts the following data fields:
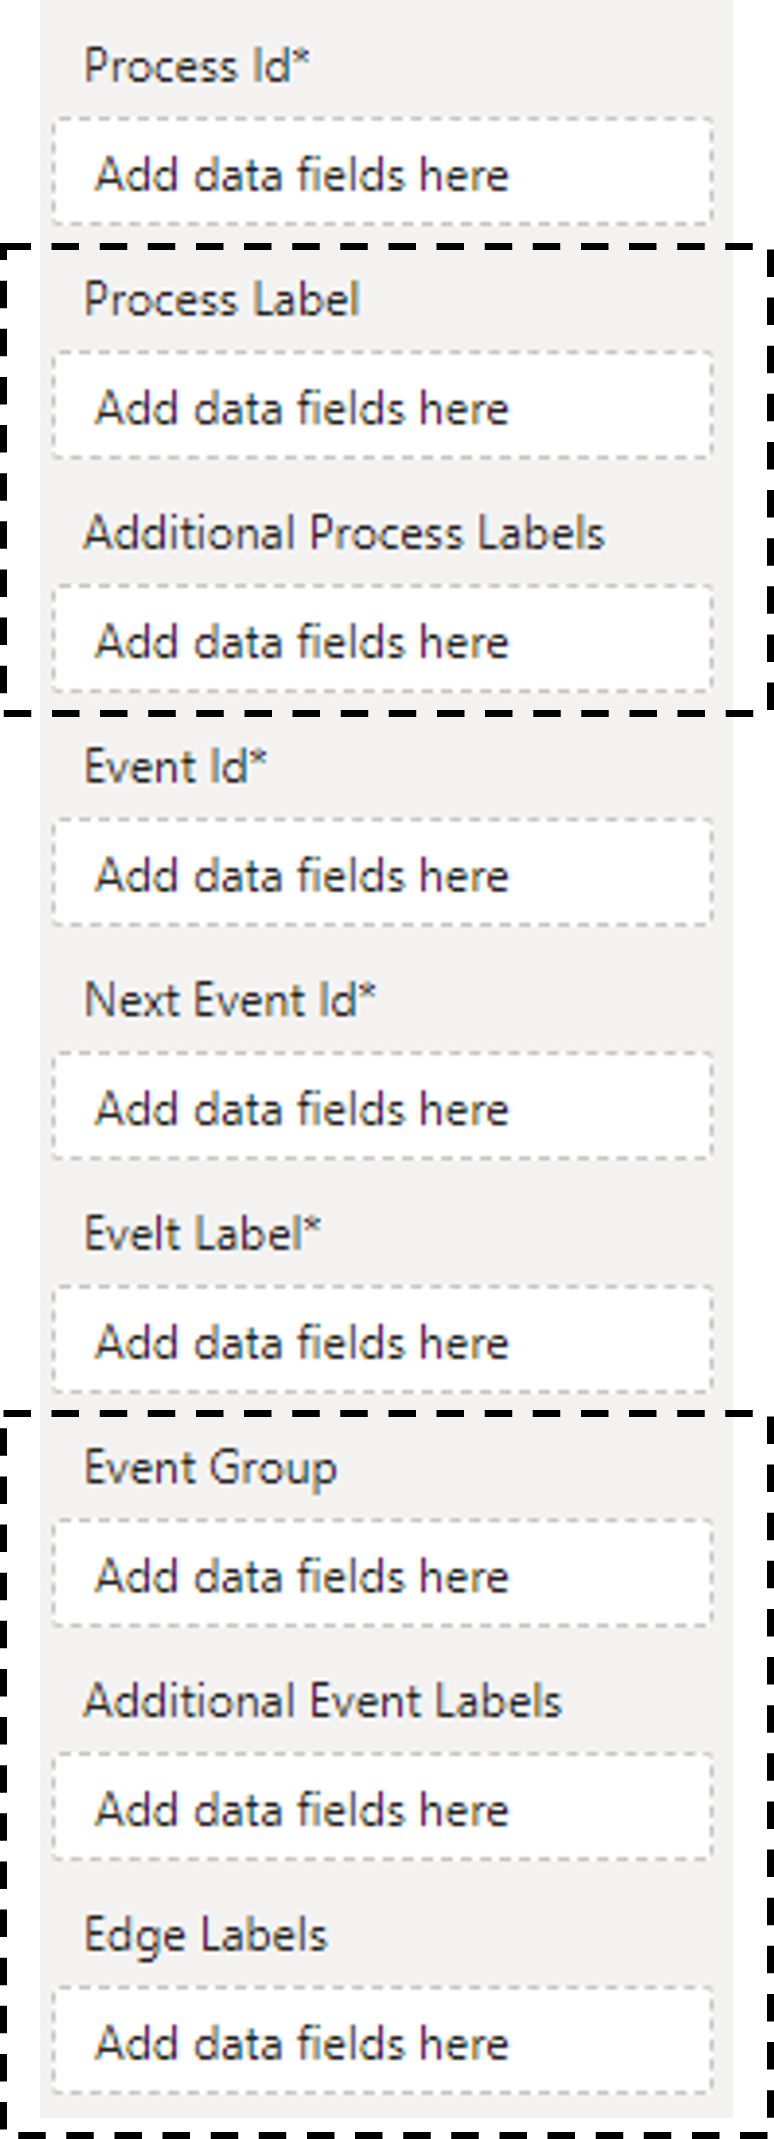
| Data Field | Description | Data Type | Allow Nulls |
|---|---|---|---|
| Process Label | Name/description of the process (max 1 field) | Any | Yes |
| Additional Process Labels | Any additional data related to whole process (max 5 fields) | Any | Yes |
| Event Group | Group to categorize/highlight events (max 1 field) | Any | Yes |
| Additional Event Labels | Any additional data related to event (max 5 fields) | Any | Yes |
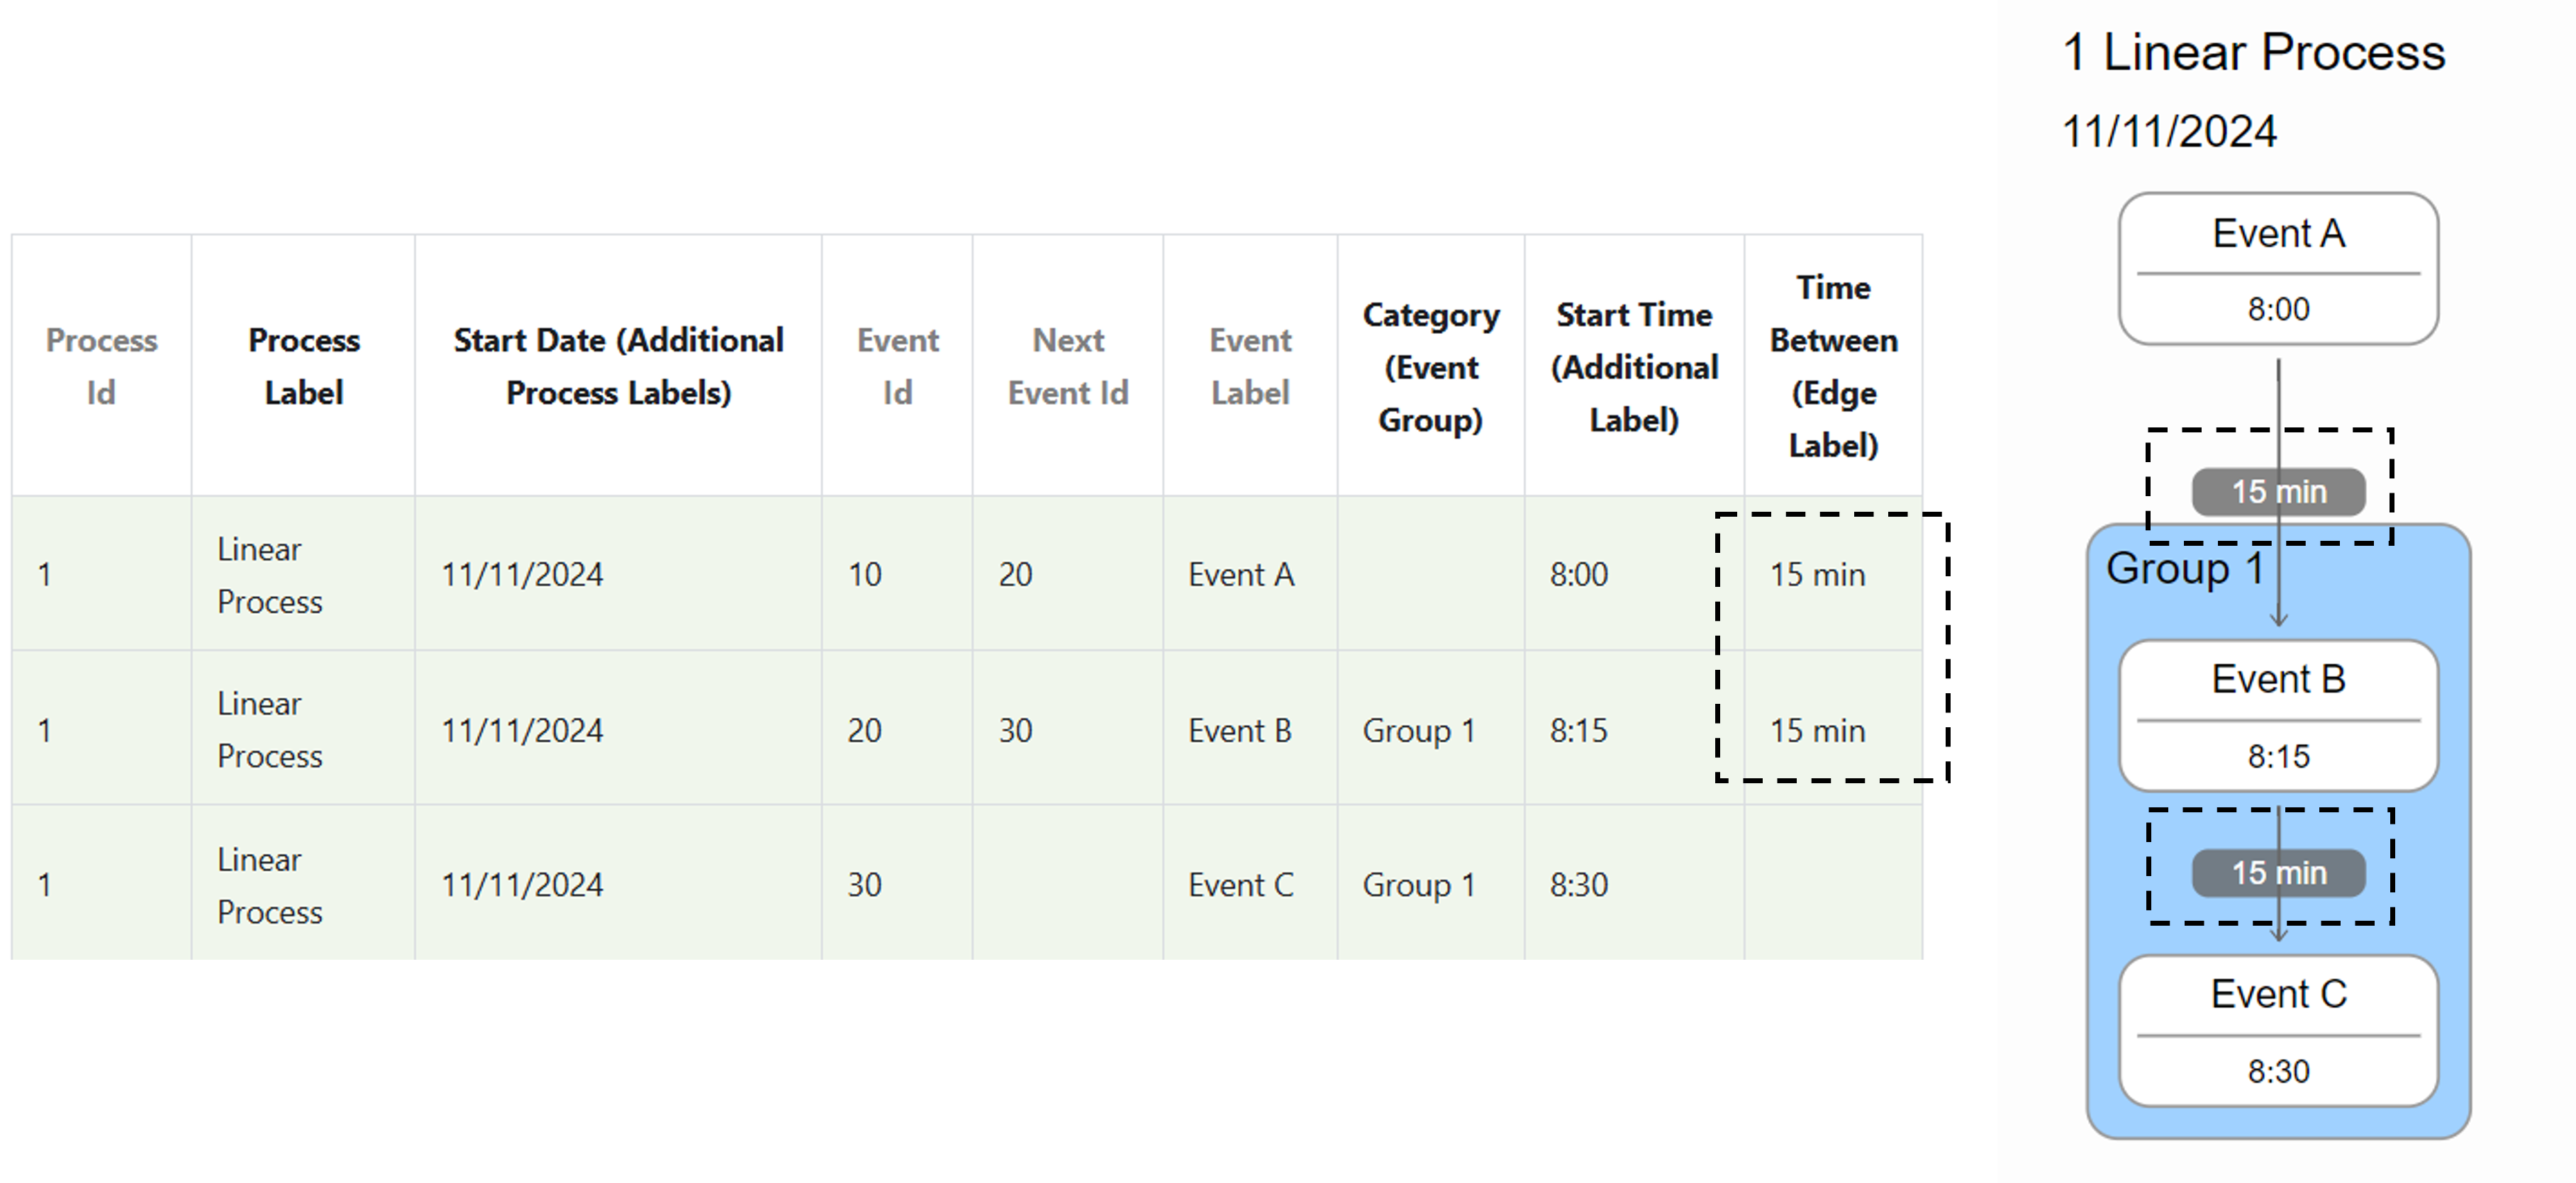
| Edge Labels | Any additional data related to edge between events (max 3 fields) | Any | Yes |
Let's add these to previous table:
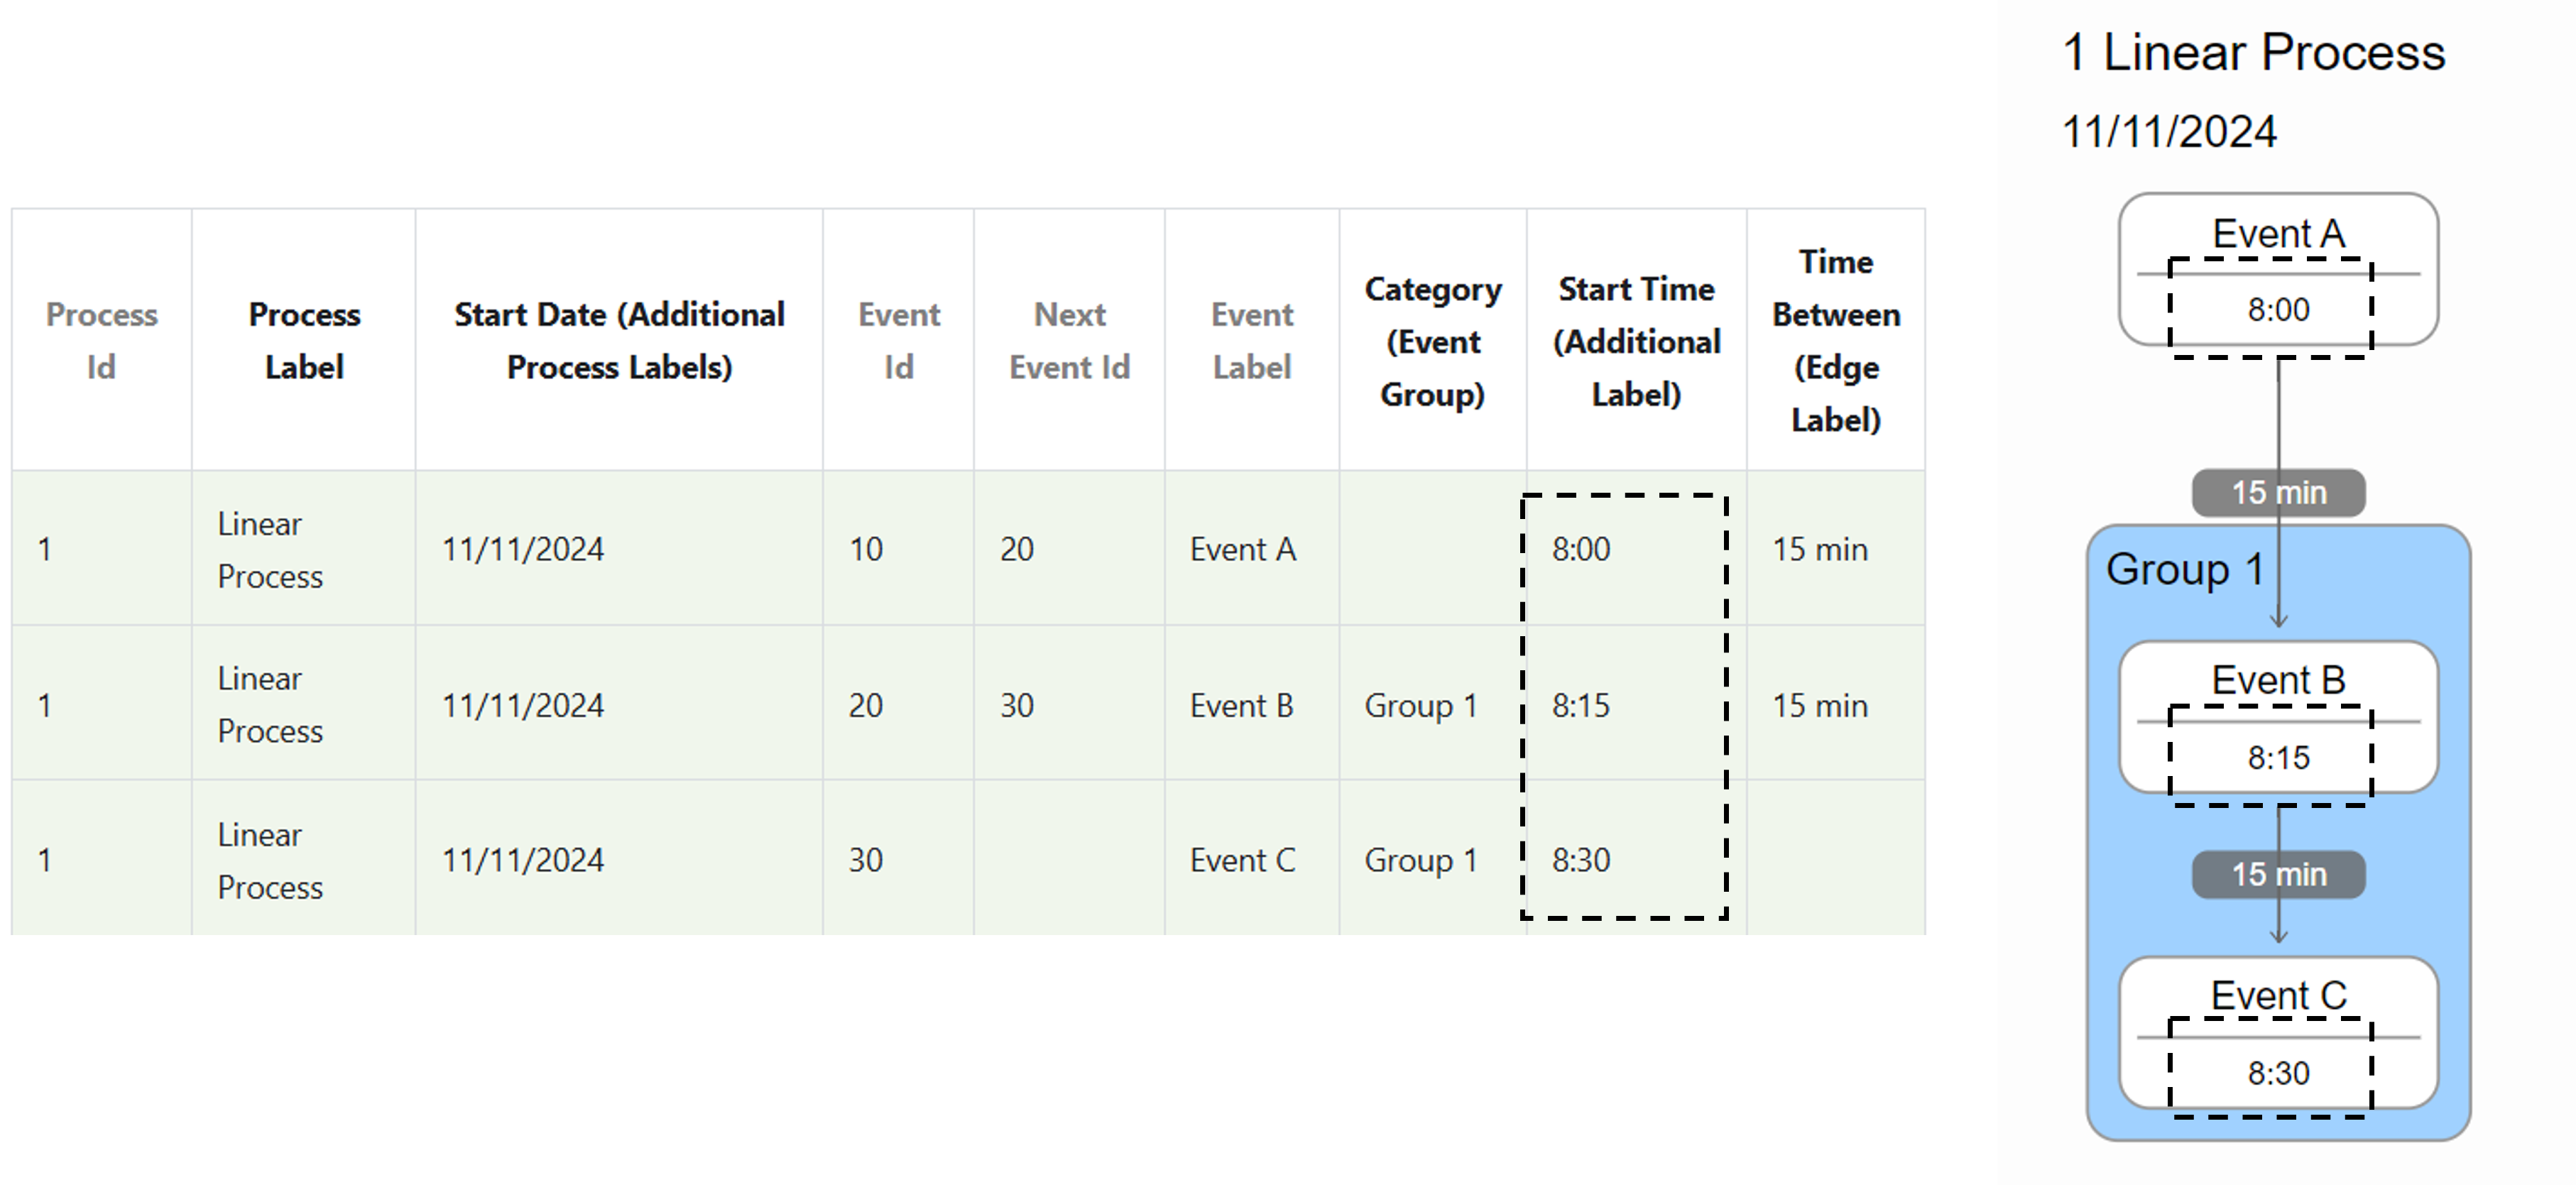
| Process Id | Process Label | Start Date (Additional Process Labels) | Event Id | Next Event Id | Event Label | Category (Event Group) | Start Time (Additional Label) | Time Between (Edge Label) |
|---|---|---|---|---|---|---|---|---|
| 1 | Linear Process | 11/11/2024 | 10 | 20 | Event A | 8:00 | 15 min | |
| 1 | Linear Process | 11/11/2024 | 20 | 30 | Event B | Group 1 | 8:15 | 15 min |
| 1 | Linear Process | 11/11/2024 | 30 | Event C | Group 1 | 8:30 | ||
| 2 | Merging Process | 11/11/2024 | 10 | 30 | Event A | 9:00 | 10 min | |
| 2 | Merging Process | 11/11/2024 | 20 | 30 | Event B | 9:00 | 10 min | |
| 2 | Merging Process | 11/11/2024 | 30 | Event C | Group 2 | 9:10 |
How data can be seen in Process Chart
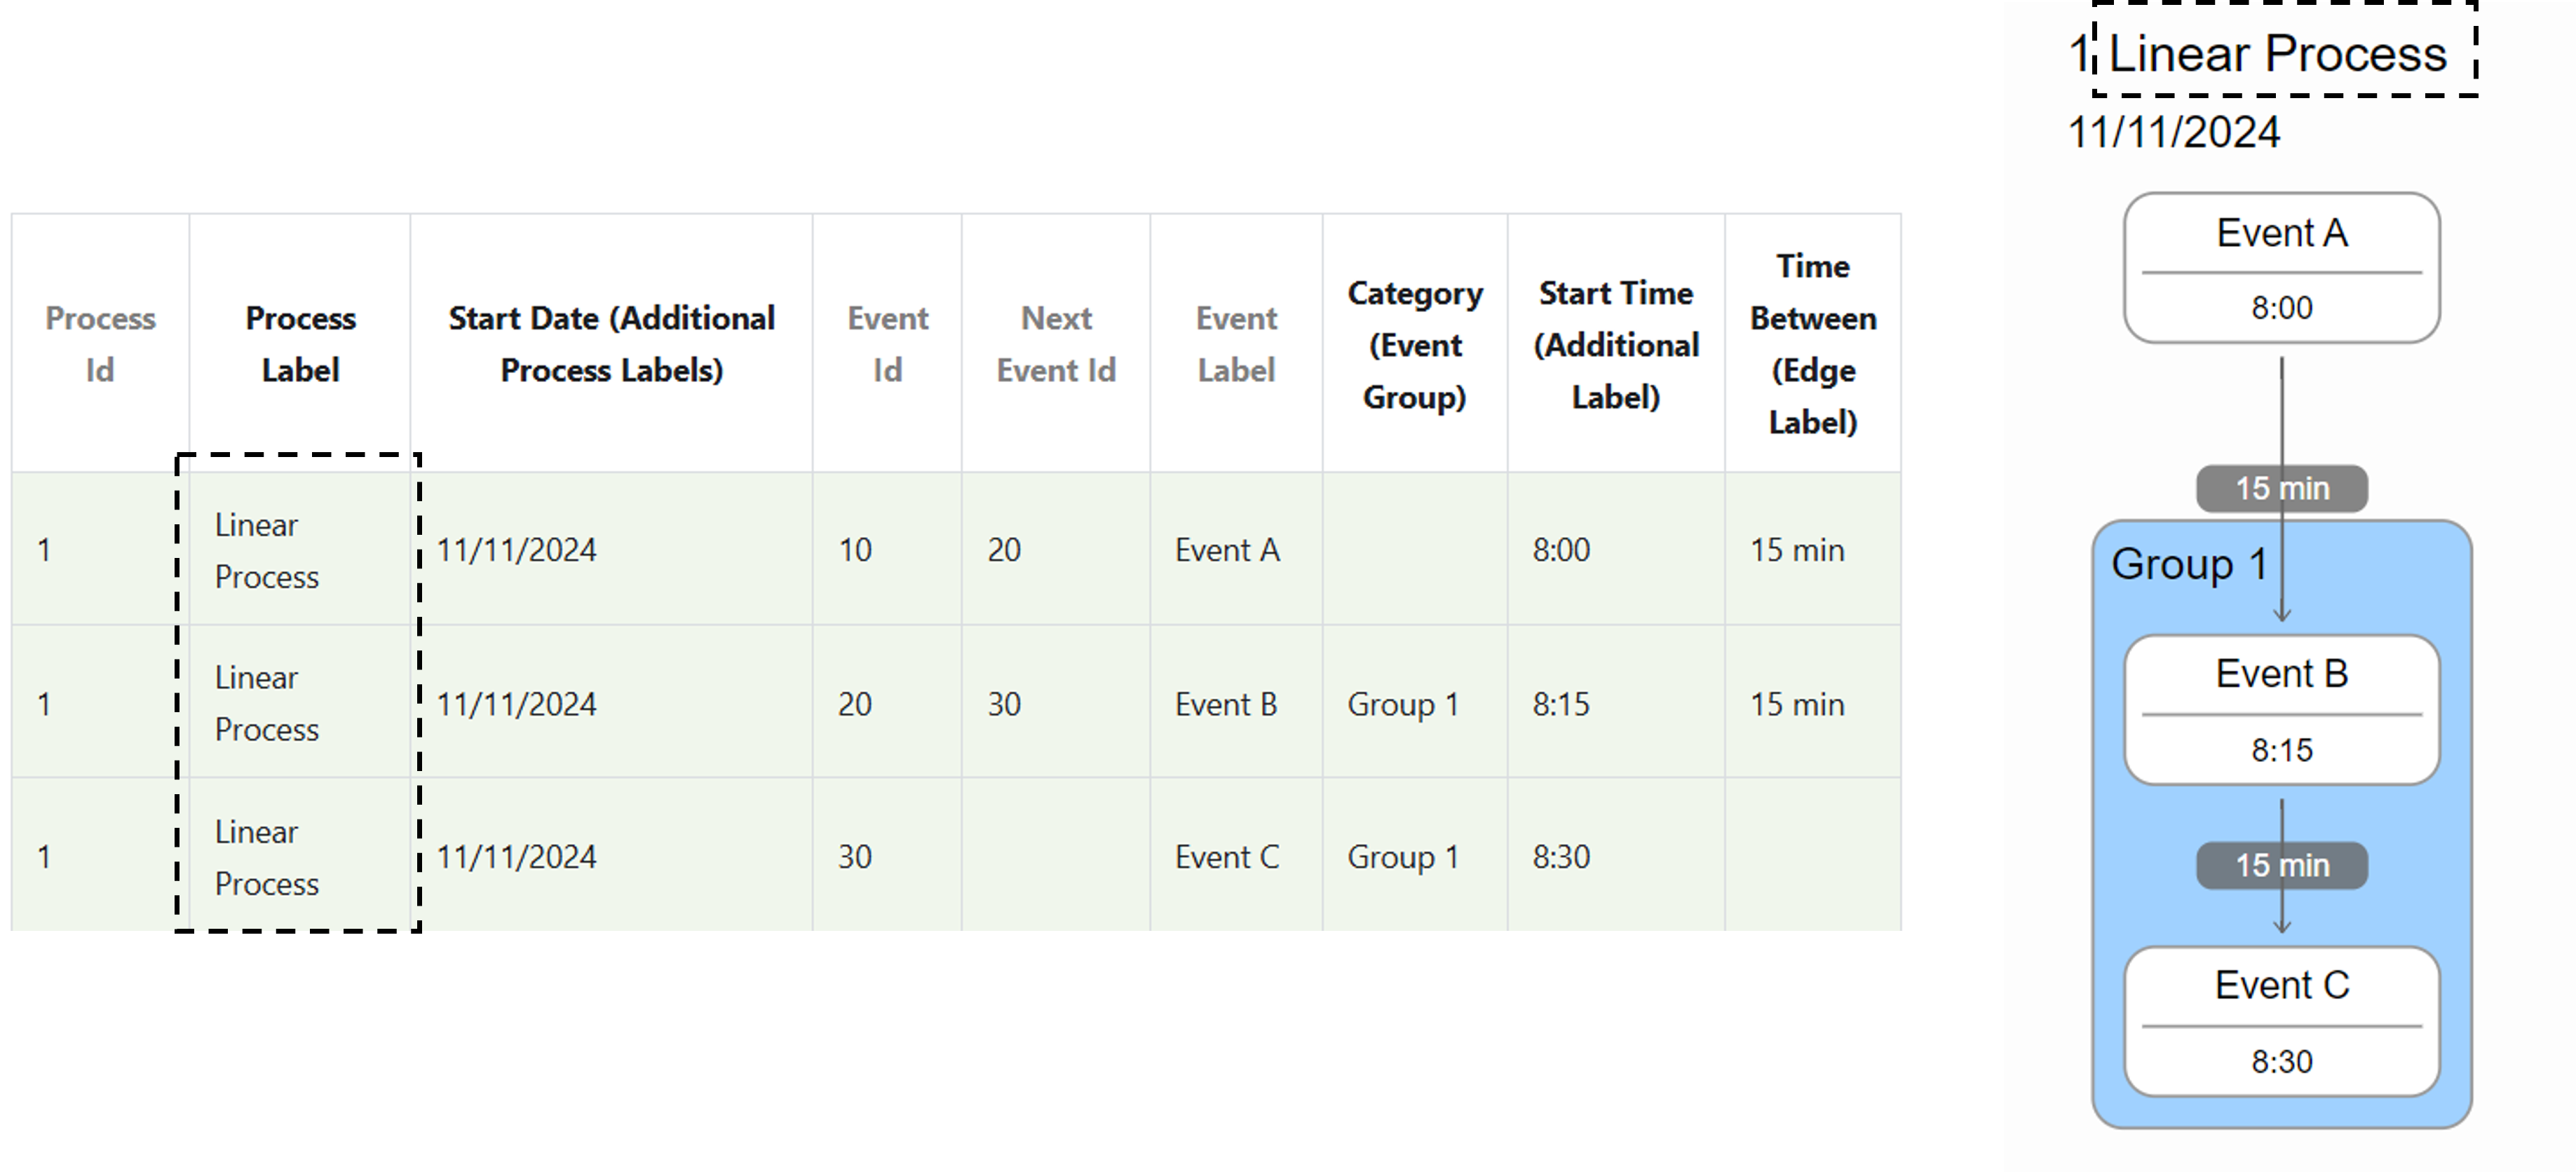
Process Label is added after the process id.
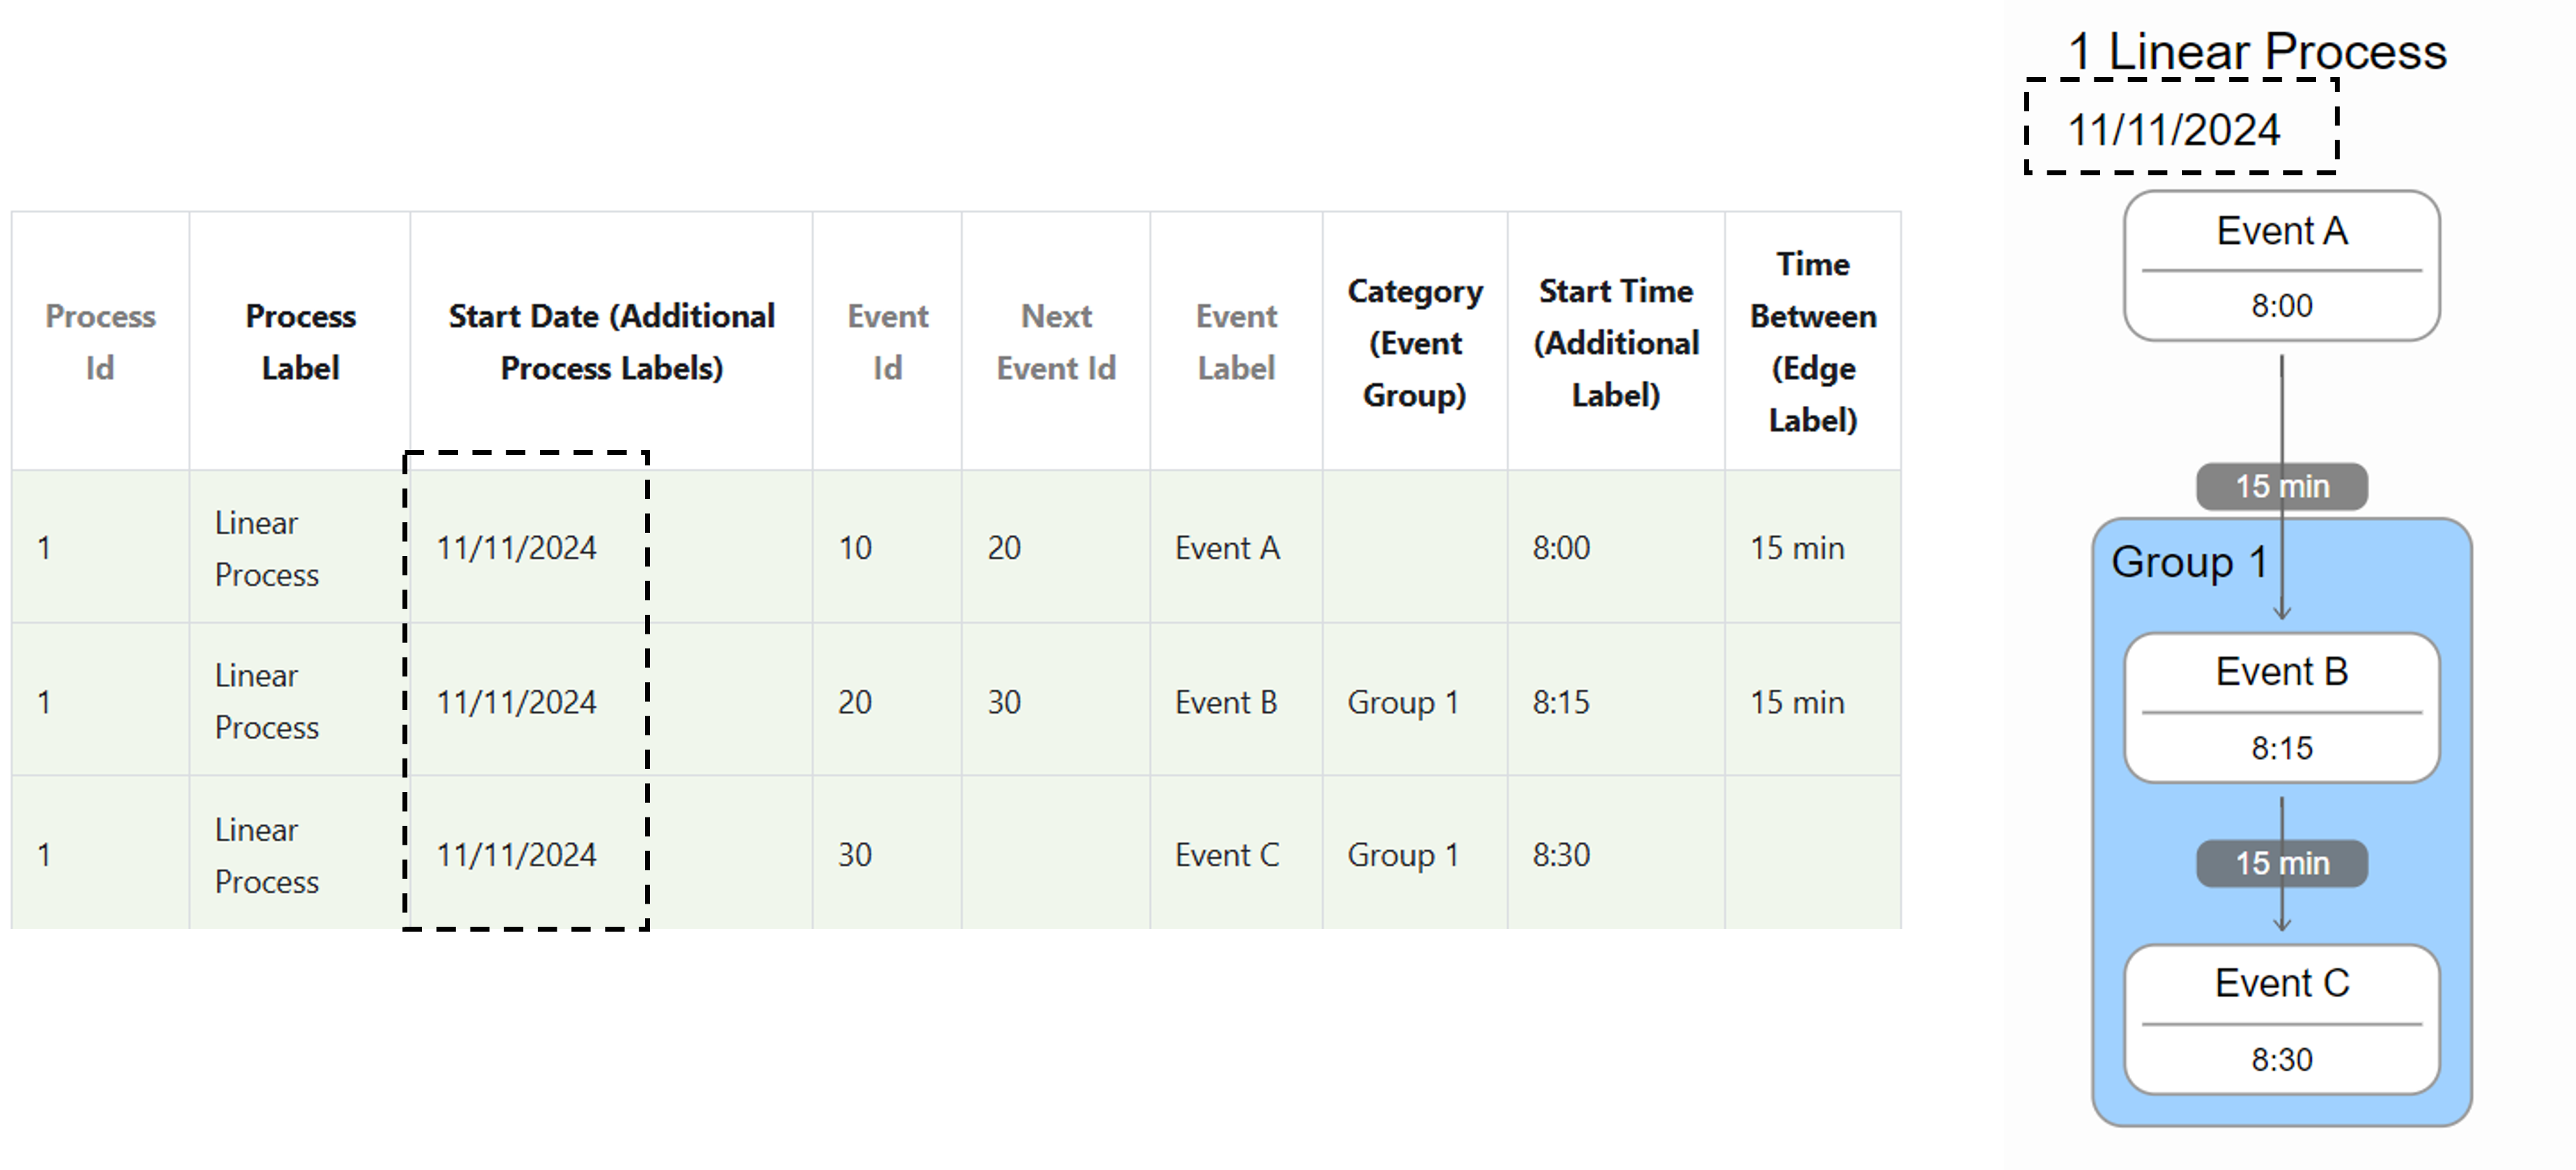
Additional Process Labels are added below the process id.
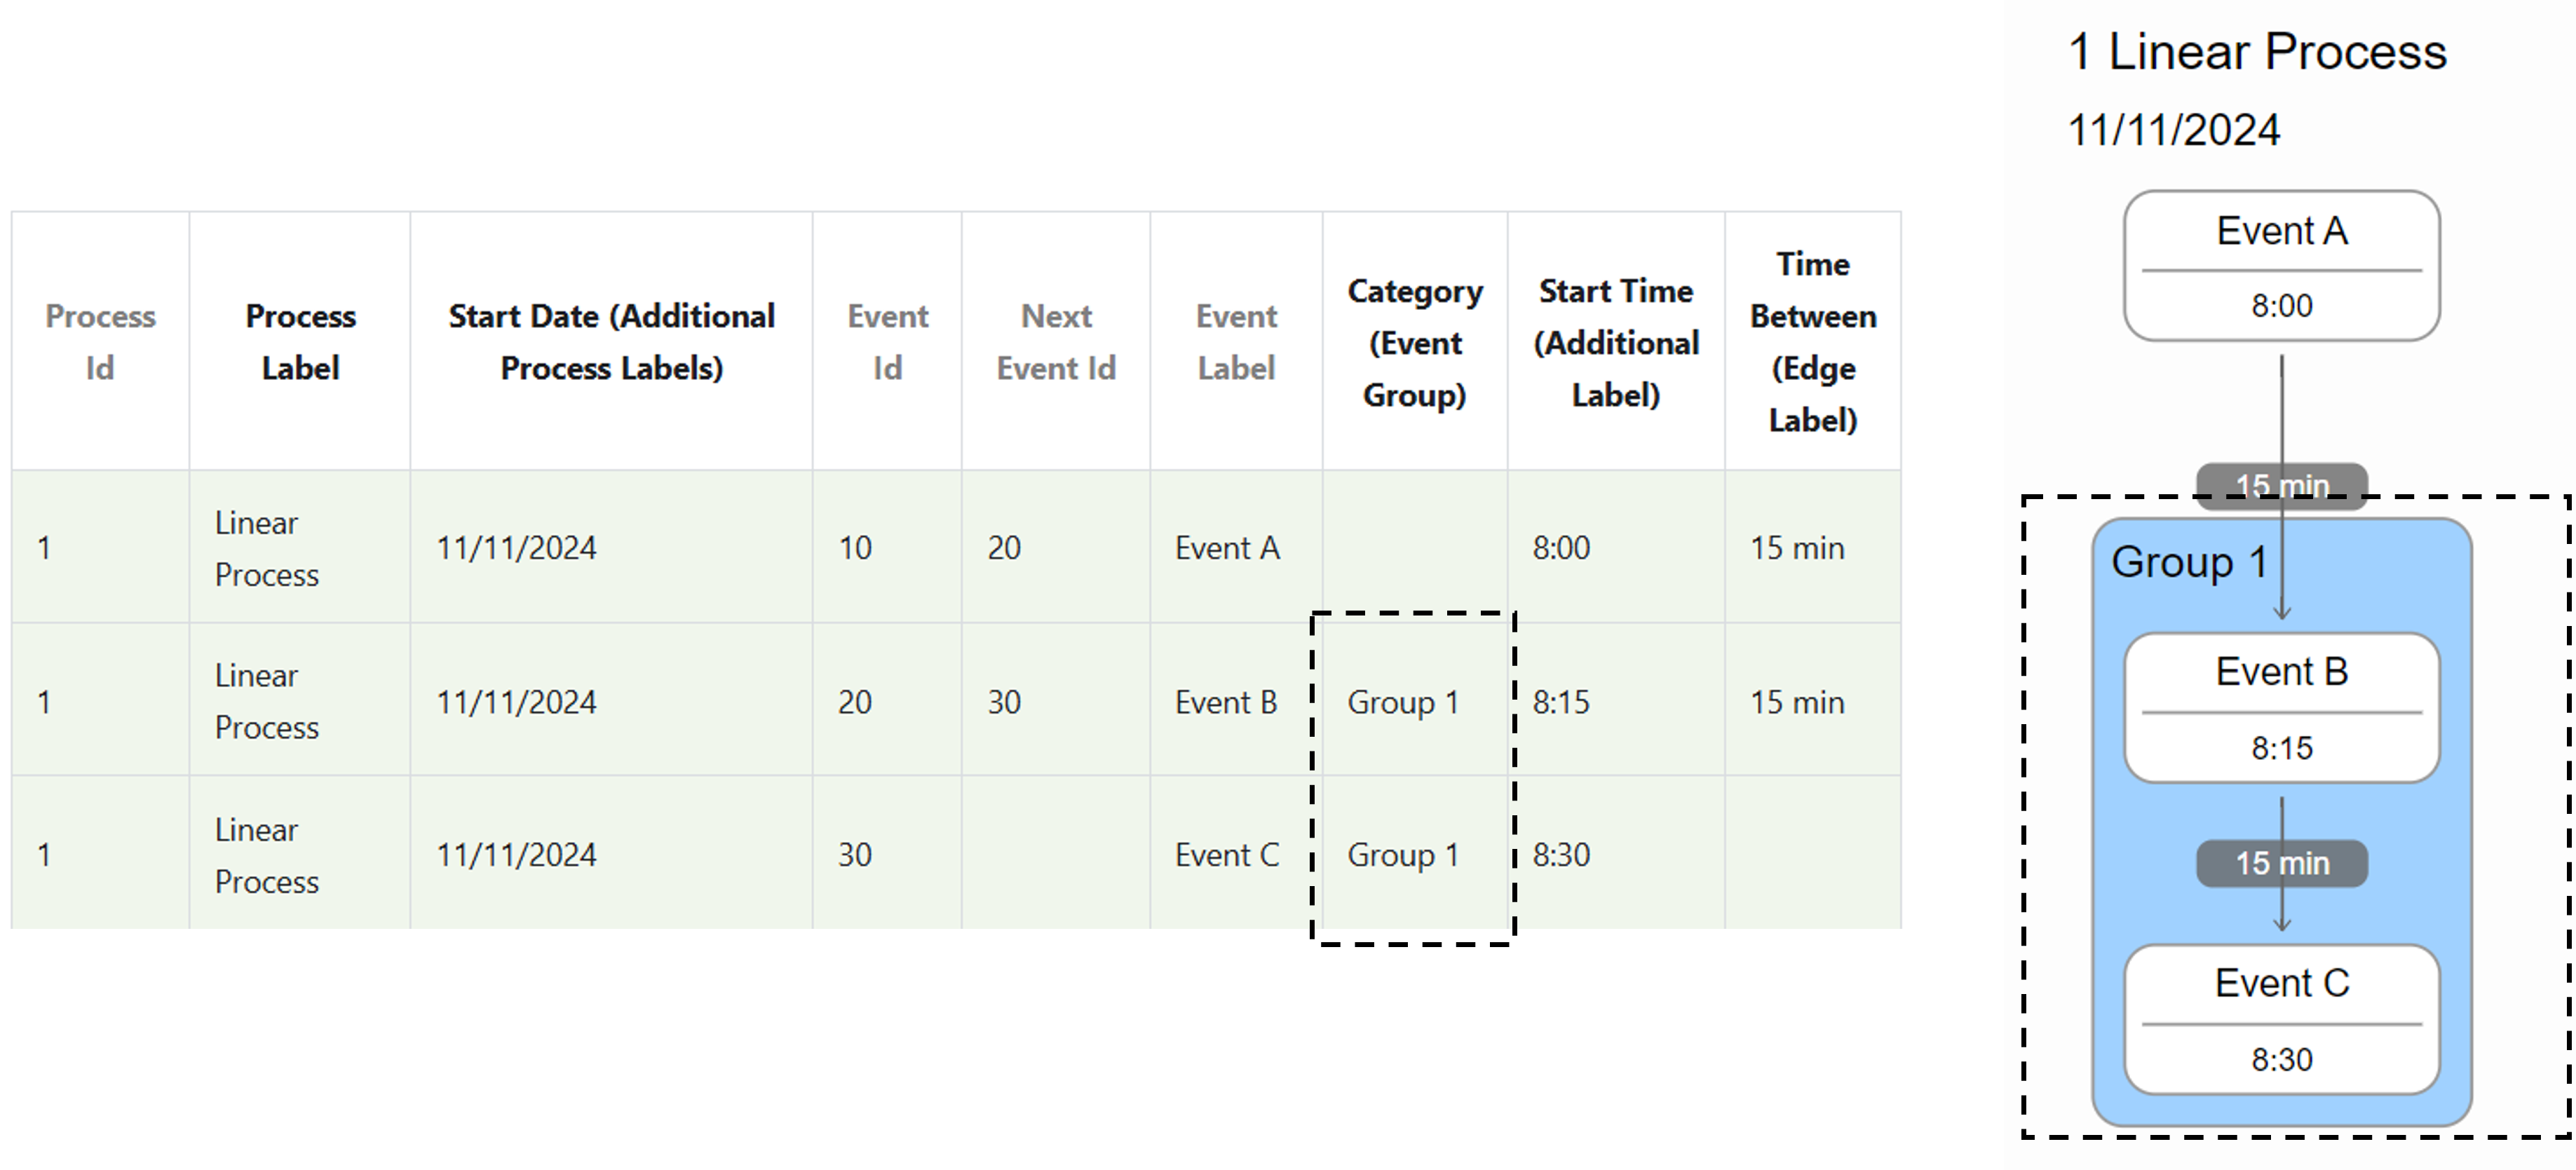
Event Group creates parent nodes around grouped nodes.
Additional Event Labels can be seen inside the node, below the event label.
Edge Labels can be seen in the middle of the edge, between nodes.
Conclusion:
- Process Label describes whole process
- Additional Process Labels displays additional data related to the whole process
- Event Group groups events
- Additional Event Labels displays additional data related to the event
- Event Labels displays related data between events